Parseq
A statistical approach for transcription landscape
reconstruction at a basepair resolution from RNA Seq read counts.
Overview:
Parseq is based on a state-space model which describes, in terms of abrupt
shifts and more progressive drifts, the transcription level dynamics along
the genome. Alongside variations of transcription level, the model incorporates
a component of short-range variation to pull apart local artifacts causing
correlated dispersion and a term related to the variability comming from the
amplification. Reconstruction of the transcription level relies on
a conditional sequential Monte Carlo approach that is combined with
parameter estimation in a Markov chain Monte Carlo algorithm known as
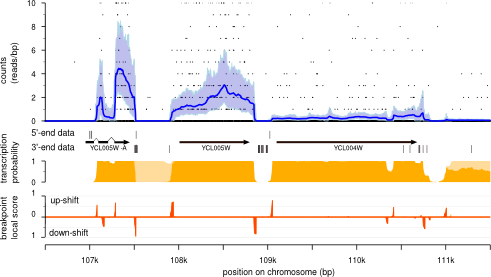
particle Gibbs. The method allows to estimate the local transcription level,
to call transcribed regions, and to identify the transcript borders.
Parseq implements parameter estimation and transcription landscape
reconstruction in 3 steps:
- Estimation of read count emission parameters
- Expression profile &transcription dynamics parameter estimation
- Transcript calling and border estimation
The first two steps are included in
the Parseq_pmcmc application.
No prior parameter estimation is
required though
using Parseq with (partially) given
parameters is possible
(parameter definition in Parseq_initial file in the counts folder).
The third step uses the expression level and transcription profile samples
(obtained in Parseq_pmcmc output) to estimate transcription breakpoints, transcription probability
and mean estimate of the expression level. With the expression sample the user can also infer
credibility intervals for the expression level.
Download:
Parseq sources are available here.
The instructions needed to use Parseq (including pre-processing) are detailed below, but you can also download a file
with the complete set of commands here.
System requirements:
Linux or Mac OS X.
A C++ compiler is needed to produce the set of Parseq executables.
Parseq instalation requires that the GNU Scientific Library
(GSL) is installed on your system.
For practical and
intuitive interpretation of the Parseq result
we also recommend using a genome viewer (such as IGV).
Installation
- Unzip the sources in a directory of your choice
- run make
- copy the parseq executables to a directory accessible in your $PATH
0- Preparing data for a Parseq run:
Parseq uses as input data counts of the 5' end of aligned reads and compute
the transcription profile along the genome, so you first need to align your reads to the
reference genome with the alignment tool of your choice.
You can for instance use Bowtie to align the reads:
 bowtie -S <organism_index> <reads.fastq> | \
			samtools view -bS -o <aligned_reads.bam>
Parseq also needs the information of the reference genome to predict Open Reading Frames (ORF) regions and use them to estimate count overdispersion and local correlation.
Parseq needs 3 files to run:
-
Reference genome (in fasta format)
-
Read counts of 5' ends (wig file)
-
Chromosomes sizes (a chrom.sizes file in IGV format)
Examples of Parseq input files are given here.
To generate the read count file you can use the following igvtool command
igvtools count -w 1 --postExtFactor 1 --strands read <aligned_reads.bam> \
      <counts.wig> <chrom.sizes file>
1- Estimation of read count emission parameters

Parameters related to the emission distribution of the counts and the biases introduced
by the library preparation are estimated in a first time (before running the Particle Gibbs
algorithm).
The estimation is done on the whole genome. Amplification parameters are estimated on low
expression regions, overdispersion of the counts is estimated on all ORFs and local correlation is
estimated on long ORF (with a length > 2000 bp).
The output of this first Parseq step is written in a folder named counts in the current directory:
./counts/Parameters_initial
(An example of parameter file is in the example folder here).
If a Parameters_initial file is provided this step will be skipped.
2- Transcription profile reconstruction

Transcription profile is reconstructed for each chromosome.
Parseq can now be run with the command:
Parseq_pmcmc <speed> <organism> <strand> <chromosome> \
             <data folder> <results folder> <parseq folder>
The parameters are as follow:
-
<speed>- can take values"best"or"fast".
In configurationbest, Parseq will run the 3 Particle Gibbs steps (including the update of u * s) and will consider the trajectory reconstruction done at fixed parameters (after the joint parameter and transcription profile estimation). In configurationfast, the algorithm will include only the first 2 PG steps and trajectory reconstruction will be done jointly with the parameter estimation. Thefastoption implies up to a 2 fold speedup with respect to thebestoption with only a small loss in the quality of results. <organism>- the name of the organism (used to search for the<organism>.chrom.sizesfile)<strand>- possible values are"all","+","-"} for the run to be performed respectively on both strands, on the Watson strand or on the Crick strand-
<chromosome>possible values are"genome","genome_frag"or a chromosome name for the run to be performed: i) on the whole genome sequentially for each chromosome; ii) on the whole genome sequentially for each chromosome fragment or iii) on a specific chromosome. If you want to run a chromosome fragment use the name"where_part_ " "x"indicates the first position of the fragment; <data folder>- path to the folder containing counts, sequence and .chrom.sizes files;<results folder>- output folder path;<parseq folder>- Parseq sources folder.
Parseq produces samples of expression and breakpoint profiles for each chromosome.
3- Calling transcripts & post-Parseq

Standard output of Parseq algorithm consists in samples of expression and breakpoints profiles.
These samples can be used to obtain the average expression profile and estimations
with average and credibility intervals of the transcription probability and transcript borders.
Transcription and breakpoint probability can be estimated for expression above a user given
threshold.
Run Parseq_particle2proba
scripts to obtain the estimation of the transcription profile and the
breakpoints.Through a local score approach, with default or user given
penalty, breakpoints are clustered in high scoring regions. The local
segment mean is provided toghether with the segment cumulative
breakpoint probability:
Parseq_particle2proba <exp_threshold> <organism> <strand> <chrom>\
              <data folder> <results folder> [score penalty]
<expression_threshold>- background expression level threshold.<organism>organism name as in the ".chrom .sizes" file.<strand>- values: "all" for a run on both strands; strand name ("+","-") for a run on a specific strand.<chrom>- values: "genome" for a run on the complete genome; "genome_frag" if the genome was previously fragmented; or chromosome name if estimation should be done only on one chromosome.<data folder>- path to a folder that includes the counts sub-folder (with the ".chrom .sizes" file).<results folder>- path to the folder where Parseq_pmcmc results are stored.[score penalty]- breakpoints penalty score (background probability). Default value: 0.05.
The output consists in wig files for the average profiles:
-
Expression_<strand>.wig- expression level average along the chromosomes -
Trans_<strand>_<expression threshold>.wig- transcription probability at position resolution accounting only for expression level above a user given expression threshold. -
[5',3']_<strand>_<expression threshold>.wig- probability for start or stop borders accounting for the user given expression threshold. -
breakpoints_3_5_<strand>_<expression threshold>.bed- breakpoints with local cumulative probability above 0.2.
To call transcripts run Pardiff. It uses the expression and transcription profiles (files:
Expression_<strand>.wig, Trans_<strand>_<expression threshold>.wig)
to reconstruct homogeneous units. For one condition it calls
transcripts. For two conditions it calls transcripts and Differentially
Expresed (DE) units.For one condition run:
Pardiff <exp_threshold> <condition> < folder>
For two conditions run:
Pardiff <exp_threshold> <fold threshold <condition1> <data folder1>\
			 <condition2>  <folder2>
<exp_threshold>- background expression level threshold.<fold_threshold>- fold change threshold above which DE should be considered.
<condition>-conditions (organism name) as found in the ".chrom .sizes" file.<data folder>- folders containing the counts and results folder ( inwhich notably there should be theExpression_<strand>.wig,Trans_<strand>_<exp threshold>.wig files.
An example of Parseq results is provided: here.
Contacts:
For questions, comments or suggestions feel free to contact Bogdan Mirauta (maintainer), Pierre Nicolas, or Hugues Richard.
Citation:
- B.Mirauta, P.Nicolas*, H.Richard* Parseq: reconstruction of microbial transcription landscape from RNA-Seq read counts using state-space models, Bioinformatics, 30(10):1409-16, 2014.
Last Update August 2014


